I’ve taken a dive into data on the Russian economy to better understand Russia’s relationships with the rest of the world. You can download the images if you want to read them in more detail.
Here are views of the Russian export and import economy in 2019 and 2021.
Exports, 2019
Imports, 2019
Exports, 2021
Imports, 2021
The Russian economy is a net export economy. Russian imports are dollar-valued at about 60% of the dollar value of the exports; in other words, they import a little over half the value of the products they export.
Russia’s primary exports are in the category of mineral fuels, oils, and flammable hydrocarbons, either unrefined or refined. In 2019, more than half of the total dollar value of Russian exports were in this category, down to about 45% of their export value in 2021.
The destination of Russian exports are just about half to Europe, about 40% to Asia, 5% to North America, and the rest to Africa and South America. Russia imports at roughly the same rate from the same places, except that this formulation was altered slightly in 2021, with Asia actually overtaking Europe as Russia’s primary source of imports. China, in particular went up about 5%, with Germany down 3%.
The largest single segment of Russian imports are “machines,” which range from computers to engines, with radio equipment and electrical equipment in between, along with all other manner of components for wiring, piping, and engineering. Secondarily, chemical products and transportation play a large role in Russia imports. Russia is much more reliant on Europe than on Asia for these second classes of products.

How does Russia pay for these imports? In large part with money made from the petroleum exported to Europe. A sub-selection of European countries reveals the following information:

In addition, Russia has been selling a significant quantity of industrial metals and precious metals to Europe. We can see that the backbone of the Russian economy is its natural resources.
Russia does not only export to Europe, however. If we examine Russia and China, a whopping 58% of its export value to China in 2019 was crude petroleum alone. Roughly 70% of all of Russia’s export value with China is in the fuels, oil, and hydrocarbons industry, with industrial metals filling out a sizable percentage, as well (brown). A difference between exports to China and Europe, however, is that Russia exports a sizable quantity of wood (red) and machinery (blue) of its own.

In Russia’s imports from China, we can see that it gets an even larger percentage of machinery (blue) from China. Russia also imports a large number of textiles from China (green), which is not surprising, as well significant quantities of processed iron and steel (brown), in the form of sheets, pipes, fasteners and mounts, and others forms. This highlights Russia’s dependence on Europe for chemical products (pink) and transportation (light blue), as we can see that these areas are much smaller than in the Europe import chart.
If we expand the to a larger Asian view of China, India, Turkey, and Kazakhstan, we can see a slightly more diversified export economy, with fuels, oil, and hydrocarbons being a bit less dominant, and chemical products (pink) and vegetable products (yellow), mostly wheat, being exported to these countries as well.
Imports from these Asian countries are similar to China alone, with the “machines” category being slightly less dominant.
There are many more small but critical parts of the Russia economy, and we could examine them every which way, but now I want to move on to a different view. Before I get there, I want to show you the Russian service economy:
The left graph is service exports in 2018 and on the right is service imports in 2018. Russia exported $53.3 billion worth of services in 2018, and imported $85.9 billion. Russia imported primarily “Personal Travel” services (yellow bar), and second to that, “Miscellaneous business, professional, and technical services.” We can see on the left that Russia primarily exports “Miscellaneous business, professional, and technical services” as well, and also exports significant quantities of transport services (the three maroon bars); in order: air, sea, other. Russia also exports “Personal and business travel services” to a substantial degree (the two yellow bars between the maroon bars). So, although it is a net importer of services, it seems to have the necessary services internally to achieve autarky in this field.
Now let’s move on to the other view I alluded to, which is a geographic-growth view. We are going to look at who Russia is trading with, and how that trade has changed over the last decade.
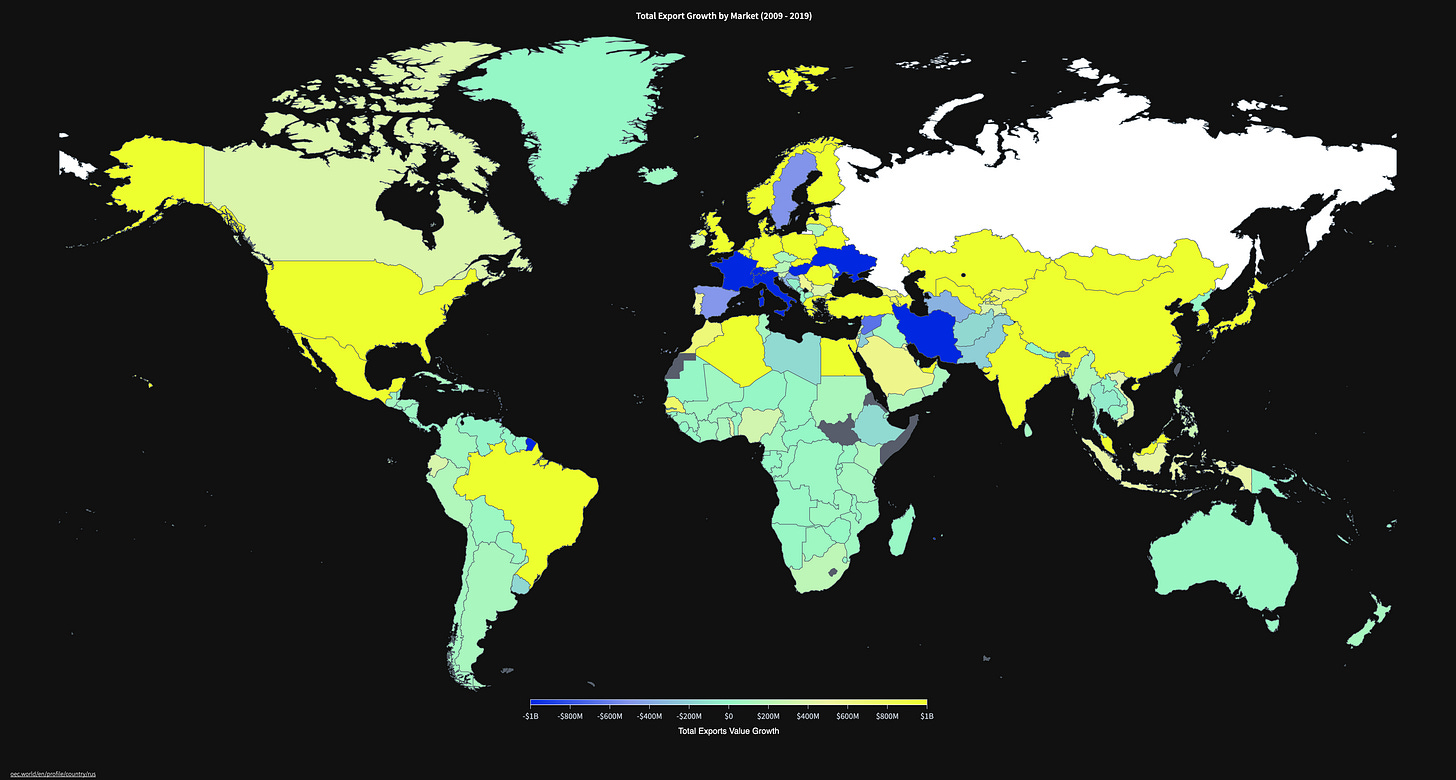
Here is a map of export growth between Russia and the rest of the world from the years 2009-2019 (ten years). You can see the key at the bottom of the image. The darker the blue, the more negative the growth. The more yellow, the greater the growth. Green is neutral, so blue-greens and beyond reveal negative growth, and yellow-greens and beyond show positive growth.
Here are some stats. These stats are calculated by comparing the 2019 value to the 2009 value. So, for example, Russia exported $16.6 billion worth of goods to China in 2009. In 2019, Russia exported $58.1 billion worth of goods to China. 58.1 minus 16.6 equals 41.5. 41.5 divided by 16.6 equals 2.5, or a 250% increase.
Fastest Growing Export Markets (2009 - 2019)
China, $41.5 billion (+250%)
South Korea, $10.5 billion (+178%)
Netherlands, $7.56 billion (+22.2%)
We can see that Russia has massively increased its total export trade to China, multiplying it by a a factor of 2.5 over a period of ten years. It is worth pointing out now how the United States fits into all of this. The growth of Russia exports to the USA over this ten year period is 44% - so why isn’t in that list of top three? Well, as we saw earlier, Russia economic ties to the USA are actually quite small - so this growth is only an increase of $4.42 billion worth of trade, as compared to the $7.56 billion of the Netherlands. Remember that growth alone is not everything; the absolute values matter as well.
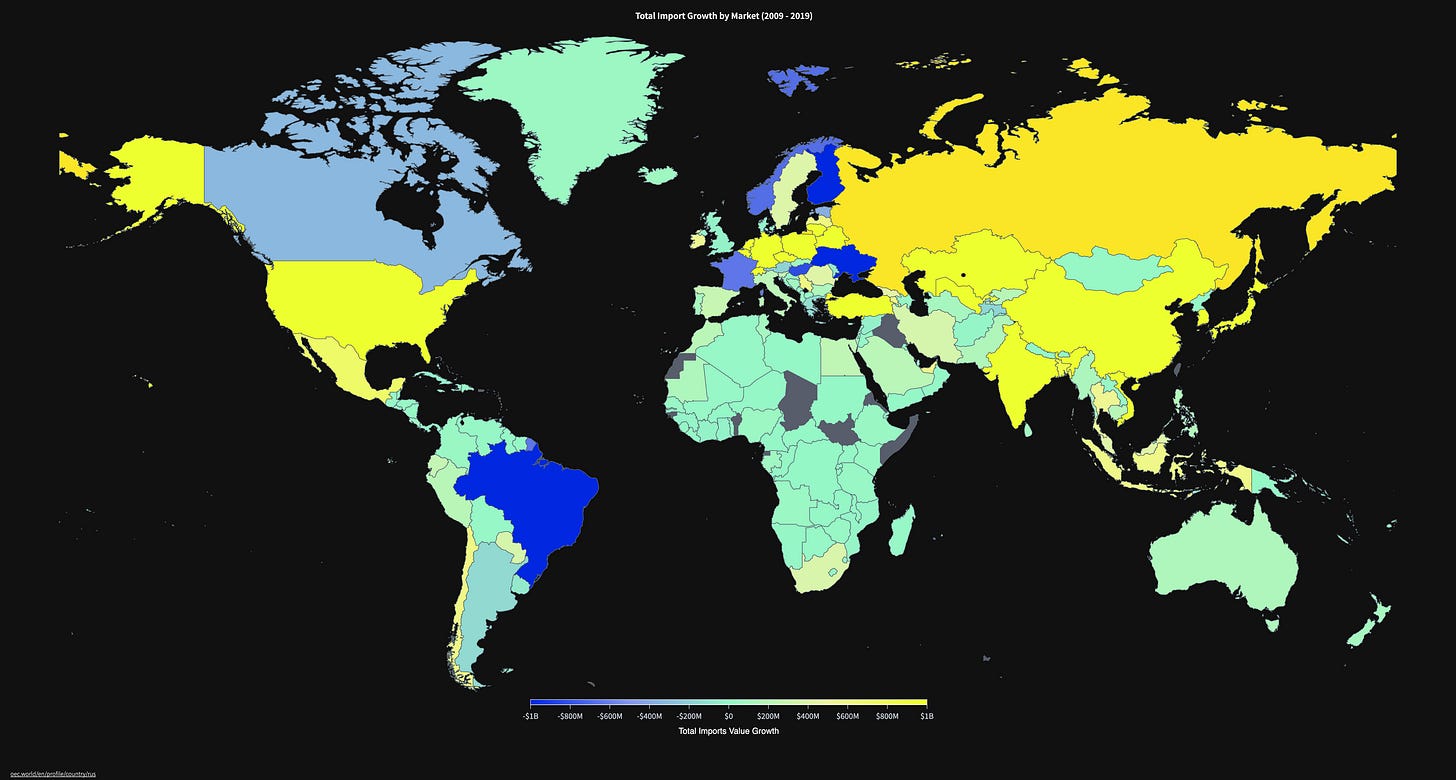
Here is import growth 2009-2019:
We can see a similar story here in the top three:
Fastest Growing Import Markets (2009 - 2019)
We see substantially increased trade with China and East Asia in general. You can see Belarus included here as well - I intentionally left Belarus out of previous charts, as I think we can regard it as a de facto part of Russia at this point; but it might be worth noting that Russia and Belarus did more closely integrated their economies of this period. You might notice as well that the Ukraine is dark blue over this ten-year view. Russian-Ukrainian integration diminished bigly over this time period, down 51.9% in exports, for a decrease of $7.14 billion. Similarly, imports went now 53.4%, for a decrease of $5.36 billion.
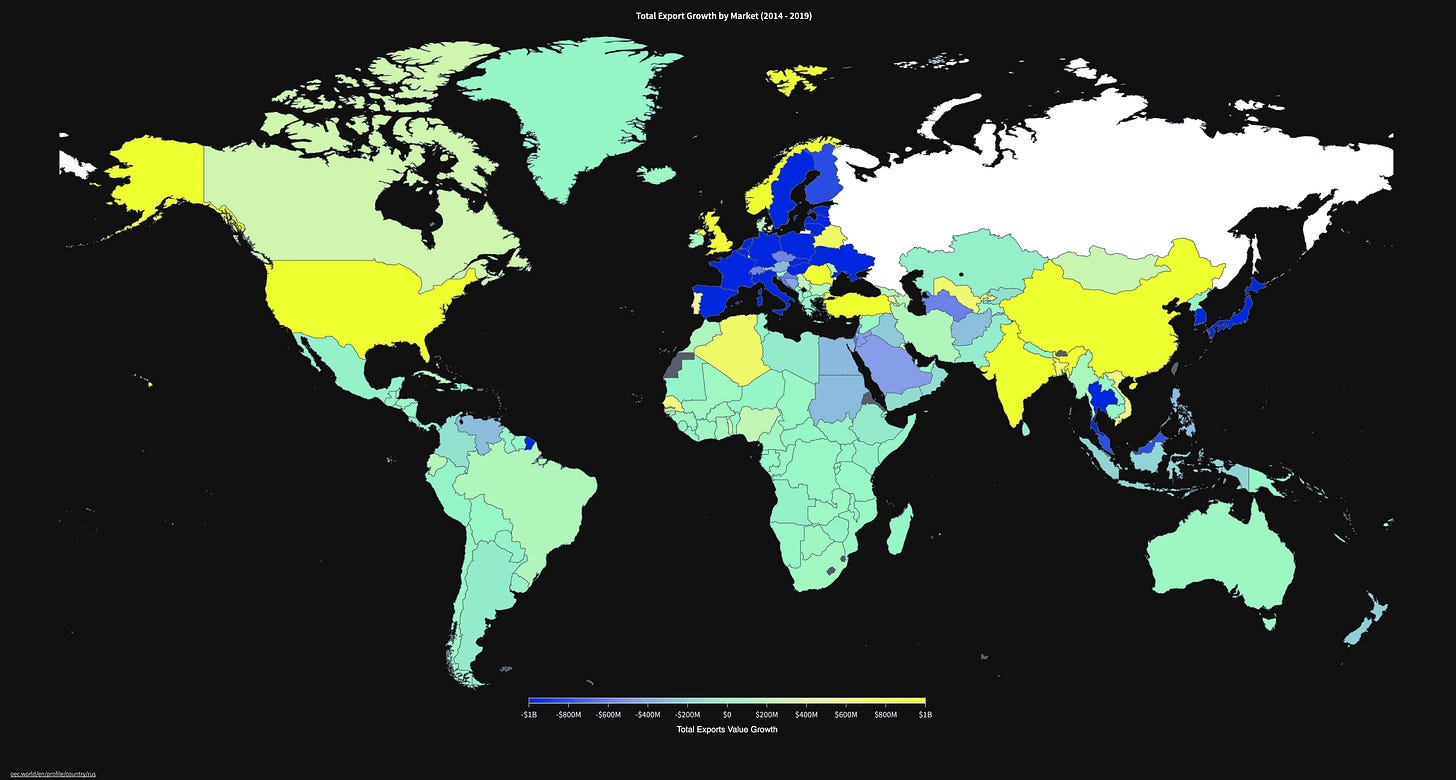
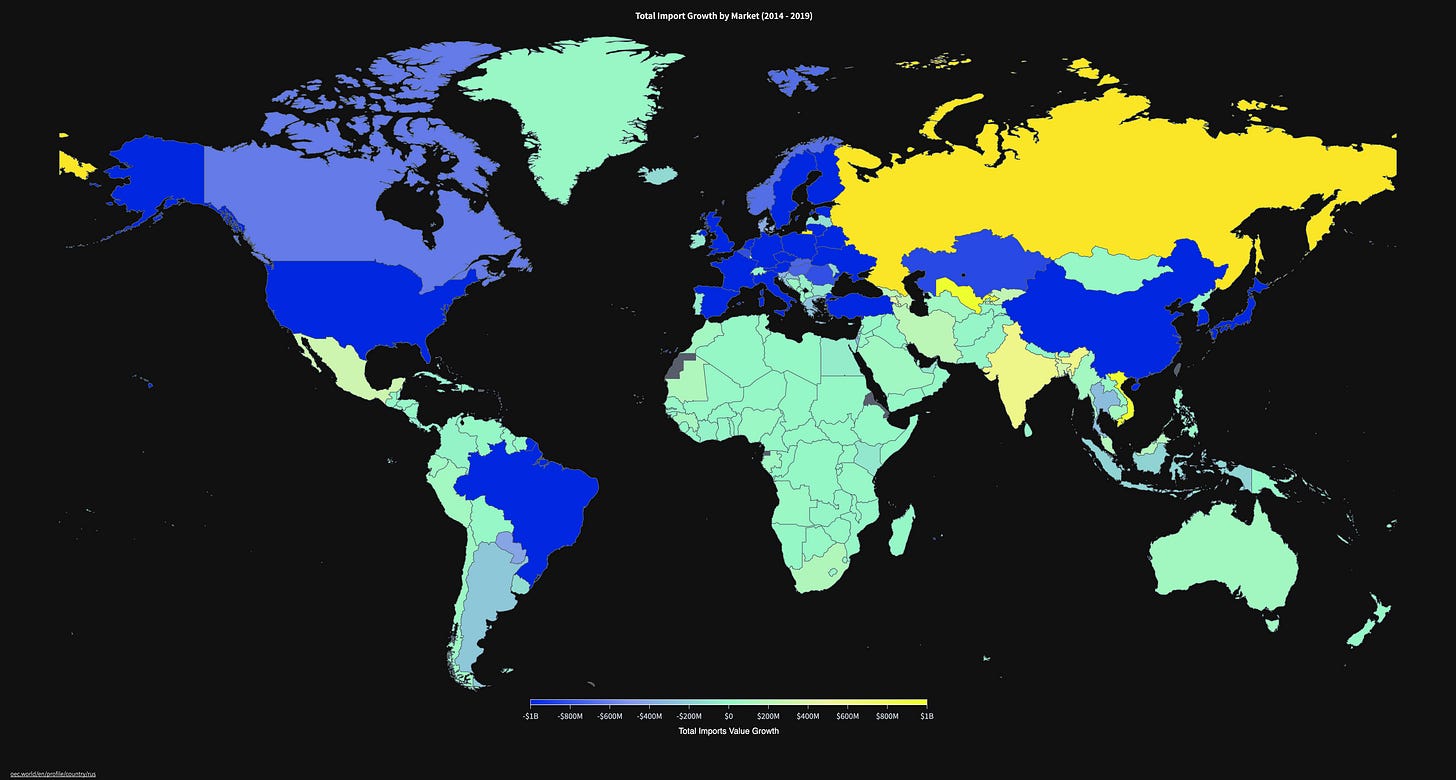
As interesting as these maps are, I find the 5 year view much more interesting. This is 2014-2019, which is significant because 2014 was the year of the Euromaidan Color Revolution in the Ukraine, a key moment in setting the international relations that led us to where we are now.
Here are the export and import growth maps.
Wow. Now that’s quite the story. However, the colors can be a bit misleading - remember these are relative to each other. Let’s take China as an example. We saw previously that Russia had massively increased its trade with China in a timeline that included this period, and yet China is blue here. This just means that over this period, imports from China went down overall, but actually not by much. China’s stats here are down on imports by 5.87% for a value of $2.94 billion, and of course Russia still increased its overall trade with China, as we can see in the exports map, where China is yellow. We can even see that the USA is yellow in that map; Russia actually exported more to the USA during this period - Europe and Japan are the only regions that are dark blue in both exports and imports. Here are the top growth stats for exports and imports during the period:
Fastest Growing Export Markets (2014 - 2019)
China, $18.7 billion (+47.3%)
United Kingdom, $3.77 billion (+42.7%)
United States, $2.04 billion (+16.5%)
Fastest Growing Import Markets (2014 - 2019)
Uzbekistan, $1.18 billion (+136%)
Vietnam, $1.12 billion (+60.1%)
India, $610 million (+24%)
During the period following Euromaidain, behind China, The United Kingdom and The United States increases the value of goods purchased from Russia more than any other country in the world - although, we should note again that these countries have overall a lesser role in the Russian economy.
Okay, now let’s just look at a single year, the most recent one in the data. This is 2018-2019 exports and imports:
We can see a partial reparation of relations in Europe, and certainly with China, One thing you may have caught, which you should certainly notice in these stats, is that Russia has substantial ties to The United Kingdom.
Fastest Growing Export Markets (2018 - 2019)
United Kingdom, $5.1 billion (+68.3%)
China, $2.73 billion (+4.93%)
Norway, $1.74 billion (+129%)
Fastest Growing Import Markets (2018 - 2019)
China, $1.13 billion (+2.46%)
Netherlands, $764 million (+12.7%)
Turkey, $759 million (+21.6%)
Norway is a bit of a standout as well, in European terms.
Finally, let’s have a look at the actual sanctions on Russia, so we can put all of this together. Examining what has actually been done by the USA, EU, NATO, and other countries, the sanctions are mostly financial and often target specific individuals, rather than Russia itself. NATO is trying to cut off Russian access to the dollar and financial services. You’ve seen this with the removal of Russia from SWIFT, the freezing of Russian assets, etc.
The most substantial economic attacks I have seen are the cancellation of the Nord Stream 2 pipeline, although this is of course an attack against future money and not current money.
Additionally, The European Commission has a plan to cut Russian gas imports by two-thirds this year, but at this stage, this is still only a plan. It could be the most substantial hit on the Russian economy out of all of the sanctions that I have seen, it is implemented.
Baidan said that the USA will ban imports of Russian oil and natural gas. Britain has also said that it will “phase out” (whatever that means) imports of Russian oil by the end of the year, and also consider banning Russian natural gas imports. Whether or not “phase out” means a total removal or not remains to be seem, and currently, banning natural gas is only under “consideration.” Specifically, the Prime Minister said “the UK will move away from dependence on Russian oil throughout this year.” To me, “move away” is certainly not the same as an unequivocal ban, but we shall see.
Additionally, the USA and Britain, as we have seen, are not exactly essential to the Russian economy in this area. I put together this graphic to demonstrate this:
The total value for Russian exports of oil and natural gas to these two countries was about $11 billion in 2019. Certainly, a lot of money to you and I, but the total value of Russian exports in 2019 was $407 billion.
The United States is also planning on implementing legislation that will revoke Russia’s “permanent normal trade relations” status, which is special jargon for having low tariffs and other advantages. Baidan could increase tariffs on Russian goods if the legislation is passed - but of course, as I have been hammering on, the USA is not exactly a major player in the Russian economy, anyway.
One of the best quotes I have seen is:
“The most commonly discussed sanctions could knock 1% off Russia's gross domestic product, according to analysts at Capital Economics, but more aggressive measures such as blocking Russia from SWIFT could reduce economic output by 5%.”
Followed by:
“According to Capital Economics, Russia's economy is in a better position to withstand a shock than in 2014, when Western sanctions and plummeting oil prices combined to knock roughly 2.5% off the country's GDP and spark a financial crisis. Russia' balance sheet is stronger, its external debt is lower, and its financial connections with major economies are smaller.”
These quotes are from the CNN Business article “The sanctions that could really hurt Russia” by Charles Riley. https://www.cnn.com/2022/02/22/business/sanctions-russia-ukraine/index.html
This doesn’t exactly inspire confidence. We also see the “Public-Private Partnership” in action as companies pull out of Russia - but frankly, depriving Russians of McDonalds and Disney Plus is not going to bring down their country. Of course there are many more companies refusing Russia business beside these, but indeed, Russians are not accustomed to the luxurious lifestyles that Americans lead, so these types of attacks are going to be far less effective in Russia than they would be in the west.
I’m not trying to be polemic, here - breaking the fourth wall a bit, I just spent the last four hours or so deep-diving into the Russian economy, and then I moved on to the sanctions, with an interest in how NATO planned on shutting it down, and all I see are some weak financial and personal attacks, as well as some minor import decreases.
Will Russia be financially damaged by these sanctions? Absolutely. Can financial damage alone take down a country? Applied properly, I expect so. Will these sanctions take down Russia? Possibly - but, gumming up Russia’s mechanisms of trade, and overall decreasing the dollar value of their products does not stop the actual workings of the Russian economy. One of the purposes of warfare is to physically destroy the enemy’s means of production, but of course (and reasonably so), NATO is unwilling to prosecute warfare beyond the economic, so there will be no physical destruction of Russia’s production. My prediction is that Russia will walk a fine line over the next decade, carefully reorienting its economy toward the Eurasian heartland, which will require expert diplomacy between Russia, China, Turkey, India, and more; but it can be done, and Russia will end up stronger for it if Russia can pull it off.
Linked here is the web site I used to generate these visualizations: https://oec.world/en/profile/country/rus
You can find the fully customizable visualizer on that page, but here is a direct link: https://oec.world/en/visualize/tree_map/hs92/export/rus/all/show/2019/
You can recreate the visualizations I linked here, if you want to see them in greater detail, or create your own. Feel free to link any interesting ones in the comments (paid subscribers can comment). Although this a free post, many thanks to my paid subscribers, as I cannot justify the time spent on projects like this without the support.


Typos: "Euromaidain", "it it is implemented"